Traditional reporting creates queues. A question goes to IT, a report is built weeks later, and by the time it arrives the number is stale and nobody can explain how it was calculated.
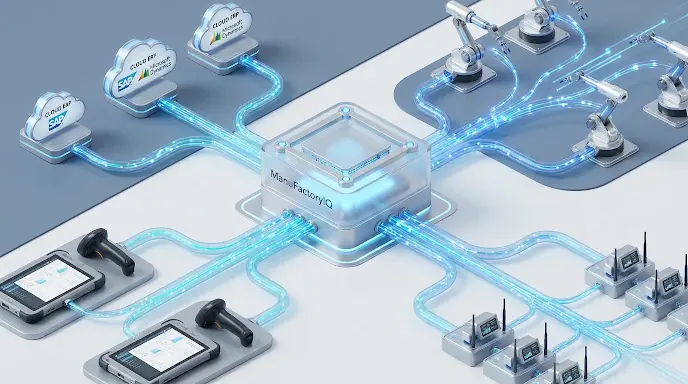
ManuFactoryIQ unifies ERP, MES, QMS, WMS, planning, maintenance, and finance data into one governed reporting layer. Ask a question in plain language and get charts, explanations, and the underlying transaction records — without SQL, an IT ticket, or another spreadsheet.
Built for executives, plant managers, and floor supervisors who need clarity now — not after the next report development cycle.

The report a supervisor actually needs is rarely the one that exists. So the question is either abandoned, or it becomes a ticket that returns as a new dashboard three weeks later.
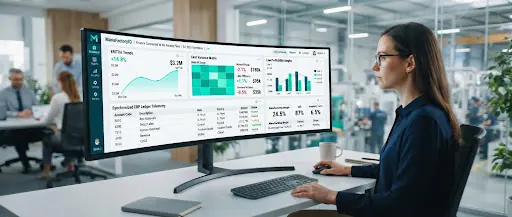
ManuFactoryIQ answers questions asked in plain language instead of requiring someone to navigate menus or wait for a new report. “Why did production fall yesterday?” and “Which customers caused the increase in expedited freight?” are answered directly.
Each answer comes with a chart, an explanation of what changed, and the supporting records — so it can be checked rather than believed.
Follow-up questions keep the context of the previous one, which is how an investigation actually works.
"Ask in plain language. Get charts, explanations, and the source records."
A dashboard shows that a number moved. It rarely shows why, and almost never when the cause sits in a different department’s system.
ManuFactoryIQ explains what changed and identifies the likely drivers behind it, connecting patterns across production, quality, inventory, supply chain, and finance.
A supplier hardness deviation that surfaces as a solder defect two stages later is the kind of relationship no single departmental report contains.
Each finding is presented with the correlation strength and the records behind it, plus the action it implies — quarantine a lot, adjust a setup, escalate to a supplier.
"Move from charts that describe to findings that explain."
Every plant accumulates a private library of spreadsheets, each one a report somebody needed and could not get. They are maintained by hand, and they quietly disagree with each other.
ManuFactoryIQ lets users build reports without coding, SQL, or IT support. Select fields, apply filters, group information, create calculations, and choose the chart or table format that fits.
A report can stay private, be shared with a team, or be promoted to a company template — which is how one person’s useful view becomes the standard one.
Because every report reads from the same governed model, a number means the same thing whoever built the report.
"Build the report you need yourself, on the same governed definitions."
An operator and a plant director need the same underlying truth at completely different altitudes. One dashboard built for both ends up useful to neither.
ManuFactoryIQ supports role-based dashboards for operators, supervisors, managers, and executives, each combining KPIs, trends, targets, alerts, tables, and action lists in one configurable workspace.
Every dashboard updates as new operational data arrives, so the screen on the shop floor and the screen in the boardroom never disagree by a shift.
Targets and thresholds are part of the view, which turns a number into a status a team can act on without interpretation.
"One truth, presented at the altitude each role actually works at."
A total nobody can open is a claim, not a measurement. Most reporting stops one level above the detail that would settle the argument.
ManuFactoryIQ makes every number, chart, and warning clickable down to the records behind it — from a company-wide KPI to the customer, order, product, machine, lot, operator, or transaction responsible for the result.
The path stays visible as a trail, so anyone reviewing the finding can see exactly how the drill-down reached that record.
No disconnected spreadsheets and no unexplained totals: if a figure exists in the hub, its evidence exists with it.
"Click any variance and land on the machine cycle, lot, and operator behind it."
Departmental reporting answers departmental questions. A warehouse shortage looks like a warehouse metric until it turns into idle line time and, two weeks later, an unexplained freight bill.
ManuFactoryIQ analyzes information across systems instead of one department at a time — connecting production losses with quality defects, inventory shortages with supplier performance, and customer demand with financial impact.
A single event chain can be followed from its origin in the warehouse through the line that starved to the surcharge finance eventually paid.
These are the relationships standard ERP reports cannot show, because no single module owns both ends of them.
"Follow one event from the warehouse shortage to the freight invoice it caused."
A daily report that is almost always normal trains people to stop reading it. By the time the one abnormal edition arrives, it is filed with the rest.
ManuFactoryIQ schedules reports by shift, day, week, or month and delivers them to the right people automatically — and raises alerts when a KPI crosses a limit, an unusual pattern appears, or an action needs attention.
Users receive the exception rather than another document to search through, with the relevant records already attached.
An alert can also start something: notify a supervisor, post to a team channel, or trigger a hold in the warehouse.
"Send the exception, not another report nobody opens."
Two teams presenting different numbers for the same month is not a data problem. It is a definition problem: yield, on-time delivery, and scrap each mean three things depending on who built the query.
ManuFactoryIQ brings ERP, MES, QMS, warehouse, planning, maintenance, and financial data into one governed reporting environment. Definitions, calculations, permissions, and sources stay consistent across every dashboard and report.
Access rules travel with the model, so a supplier-facing view and a board view read from the same definitions while showing different data.
Everyone works from the same version of the truth — and when a definition changes, it changes everywhere at once.
"One definition of every metric, shared by every report in the plant."
ManuFactoryIQ connects to SAP S/4HANA, Microsoft Dynamics 365, Oracle Fusion, NetSuite, and shop-floor IoT networks, and publishes clean datasets to the BI tools your teams already use.


See how ManuFactoryIQ unifies your ERP, MES, quality, warehouse, and finance data into one reporting layer your teams can question directly.